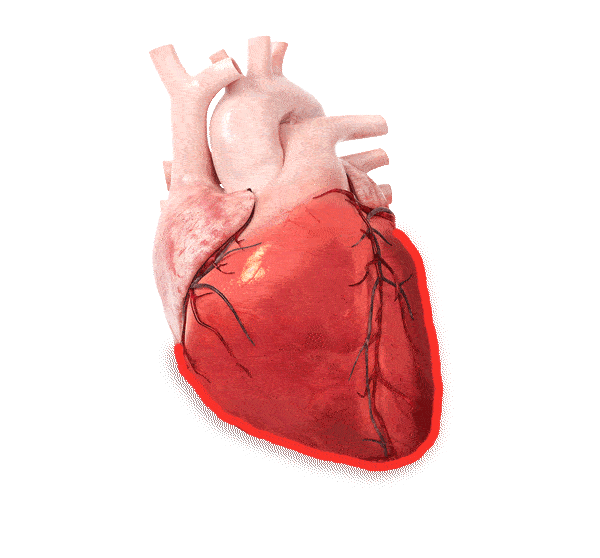
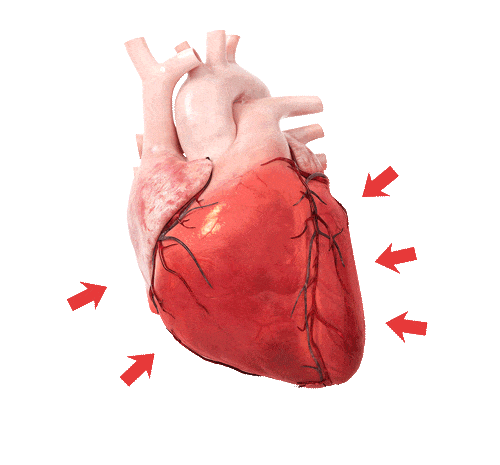
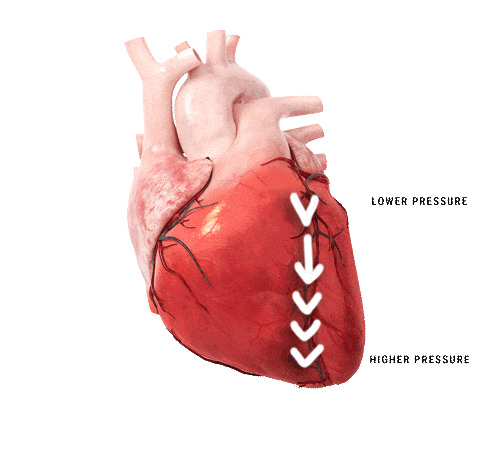
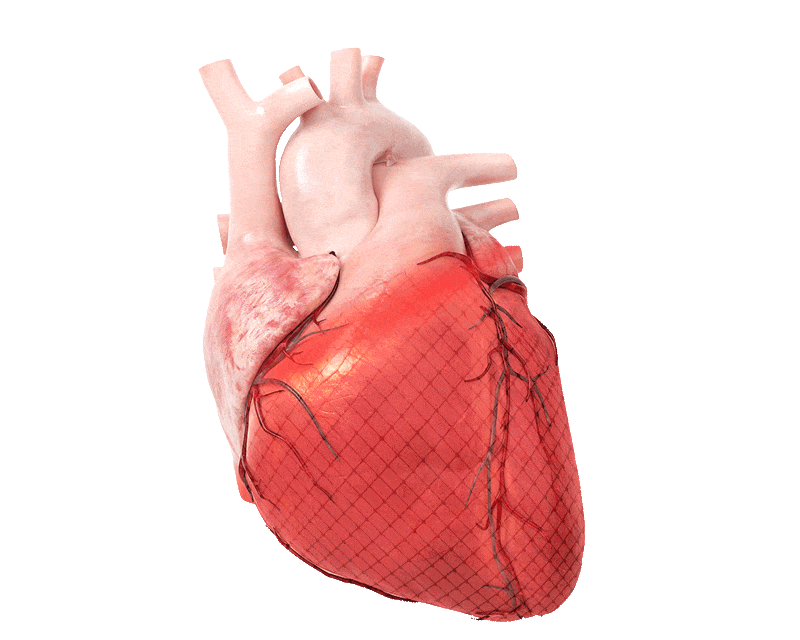
The metrics of the heart

For years now, the volumetrics have been the most used clinical measurements on how the heart functions. However, scientific evidence indicates that there is more than just the volume. Its shape, the motion of the wall and the pressure are influencing the effectiveness of the cardiac function. Measuring these metrics adds valuable information to better guide the diagnosis, treatment and follow up.  

The way you used to establish cardiac function is going to change!

Volumetrics

The current state of the cardiac systolic function can be well described based on the volumes of the in- and output of the heart. A high output volume is needed to fulfil the metabolic needs. In case of myocardial disease, the heart is unable to generate enough cardiac output. In addition, a change in volume can only be observed over time which makes early diagnosis or predicting outcome of the heart disease difficult. Additional metrics, such as shape, motion, and pressure, are necessary to make these advanced insights possible.

Shape

The shape of the heart contributes to generating blood flow towards the outflow tract during contraction. A change in shape, deformation, either regionally or globally, results in a different contraction pattern which may lead to a change in its functional power. The volumetric output can still be the same as in a healthy heart, however it costs the heart more energy to compensate for the change in contraction pattern. By detecting either global or regional deformation, prediction of major adverse cardiovascular events (MACE) becomes possible. This holds incremental prognostic information for the patients.

Motion

The myocardium moves synchronously inwards with each beat and back to the original state during relaxation to push the blood through the aorta. In case of a cardiac disease, the contractility power of the myocardium can become impaired across the entire myocardium or in a specific region. Uneven or less motion inwards can lead to a reduction in the cardiac function. With a wall motion analysis, regional abnormalities and typical disease patterns (e.g. Amyloidosis or Takotsubo) can become more easily recognizable. This makes regional dysfunction no longer a challenge to objectively and quantitively confirm the visual interpretation.

Pressure

In a healthy heart the pressure gradient will manifest in an apical-base direction representing the same direction as the blood flow. A change in the pressure gradient, either the amount or direction (e.g. due to mitral valve stenosis) will affect the effectiveness of the cardiac pumping mechanism. Intraventricular pressure gradients provide valuable insights in ventricular remodeling and can predict reverse remodeling after treatment (e.g. cardiac resynchronization therapy). This will push even further the new frontier on cardiac deformation analysis and physiology. 

Volumetrics

The current state of the cardiac systolic function can be well described based on the volumes of the in- and output of the heart. A high output volume is needed to fulfil the metabolic needs. In case of myocardial disease, the heart is unable to generate enough cardiac output. In addition, a change in volume can only be observed over time which makes early diagnosis or predicting outcome of the heart disease difficult. Additional metrics, such as shape, motion, and pressure, are necessary to make these advanced insights possible. 

Shape

The shape of the heart contributes to generating blood flow towards the outflow tract during contraction. A change in shape, deformation, either regionally or globally, results in a different contraction pattern which may lead to a change in its functional power. The volumetric output can still be the same as in a healthy heart, however it costs the heart more energy to compensate for the change in contraction pattern. By detecting either global or regional deformation, prediction of major adverse cardiovascular events (MACE) becomes possible. This holds incremental prognostic information for the patients.

Motion

The myocardium moves synchronously inwards with each beat and back to the original state during relaxation to push the blood through the aorta. In case of a cardiac disease, the contractility power of the myocardium can become impaired across the entire myocardium or in a specific region. Uneven or less motion inwards can lead to a reduction in the cardiac function. With a wall motion analysis, regional abnormalities and typical disease patterns (e.g. Amyloidosis or Takotsubo) can become more easily recognizable. This makes regional dysfunction no longer a challenge to objectively and quantitively confirm the visual interpretation.

Pressure

In a healthy heart the pressure gradient will manifest in an apical-base direction representing the same direction as the blood flow. A change in the pressure gradient, either the amount or direction (e.g. due to mitral valve stenosis) will affect the effectiveness of the cardiac pumping mechanism. Intraventricular pressure gradients provide valuable insights in ventricular remodeling and can predict reverse remodeling after treatment (e.g. cardiac resynchronization therapy). This will push even further the new frontier on cardiac deformation analysis and physiology. 

Unleash the power of heart function analysis with Medis Suite MR

At Medis we recognize the need to look beyond the volumetrics of the heart and equip you with the tools to determine changes in the heart’s function from all angles. Medis Suite MR, offers the ejection fraction, strain, inward displacement, and hemodynamic forces to enable you to measure the different metrics of volume, shape, motion, and pressure quickly and accurately. All those metrics which are also available for CT and US can greatly contribute to determining the best diagnosis and treatment strategies for your patients.  

The way you used to establish cardiac function is going to change.

Measuring volume with Artificial Intelligence

Measuring shape deformation with strain

Measuring motion with Inward Displacement

Measuring Pressure Gradients with Hemodynamic Forces

NEW

Stay Tuned, more insightful information for each metric will come soon.