Medis Tips, Tricks & Shortcuts 4th edition

18-03-2024

Welcome to the fourth edition of Medis Tips, Tricks & Shortcuts, a news section that addresses any questions of yours across all our product lines. 

Twice a year we share a short survey in which we ask our customers to rate “how likely are you to recommend Medis” and provide us with general feedback.  

We received many insightful comments that helps us keep improving in the right direction! In return, we would like to thank you by introducing this newsletter on a regular basis to ensure all your questions are addressed.

Did you miss the first two editions? No worries, you can find it here

In this edition, we have summarized the next 4 questions that can be addressed immediately:

 1. Is Medis planning to further enhance the AI contours for RV, LA and RA in Strain Analysis?

Yes, with our latest release in January, we have extended our AI for the long axis to cover all cardiac chambers (LV, RV, LA, and RA). Autonomous AutoQ now generates contours for datasets containing long-axis images, and in QStrain the thumbnails will then be automatically filled with the correct series, including AI-generated contours.

2. Can volume-time curves in Qstrain be automatically generated for all cardiac chambers?

Yes, they can. With the updated version, contours are available for all chambers, streamlining long-axis chamber analysis to just two clicks. One of the outcomes of the strain analysis is the volume time curves as shown below for the LA. The exception is for RV, in which area curves are provided instead, as RV volume cannot be calculated from long-axis images.

Figure 1: Example of a volume time curve of the LA
Figure 2: Example of an area time curve for the RV.

3. Is there a way to shorten the time of the Post Install Test (PIT) for our IT department?

Yes, in response to such requests, we’ve significantly reduced the runtime for the Post Install Test (PIT) for all instances to approximately 1 minute, with slight variations depending on computer specification. 

4. How can I set up automatic T1/T2 map selection and color map creation in Medis Suite?

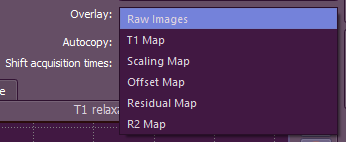
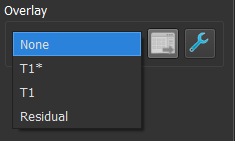
You have two options to create a color map: (1) using the clinical T1/T2 analysis in QMass or (2) the QMap research application.  In the QMap application, load the data in either Image  or  Image.  Then, on the righthand side, switch from raw images to T1 Map/T2 Map overlay to instantly see the color map of T1 or T2.

Figure 3: Example of T1 Map application on where to switch from raw images to T1 Map overlay

In QMass, load the application and ensure the selected analysis is correct. Draw a Region of Interest (ROI) as large as the image, then switch in the overlay dropdown to T1 or T2. This will apply the color map to everything within your ROI.

Figure 4: Example of T1 analysis in QMass on how to choose the T1 Map overlay

5. Can QFR be used in patients with acute coronary syndrome? (non-culprit vessels)

Multiple studies have shown successful use of QFR in assessing non-culprit vessels during acute coronary syndrome (ACS) cases.     

Reference:

  • Spitaleri G et al., Quantitative flow ratio identifies nonculprit coronary lesions requiring revascularization in patients with ST-segment-elevation myocardial infarction and multi-vessel disease. Circ Cardiovasc Interv 2018; 11: e006023. Doi:10.1162/CIRCINTERVENTIONS.117.006023
  • Sejr-Hansen M et al., Quantitative flow ratio for immediate assessment of nonculprit lesions in patients with ST-segment elevation myocardial infarction—An iSTEMI substudy.Catheter Cardiovasc Interv. 2019; DOI: 10.1002/ccd.28208
  • Lauri FM et al., Angiography-derived functional assessment of non-culprit coronary stenoses in primary percutaneous coronary intervention. EuroIntervention 2020; 15:e1594-e1601; doi/10.4244/EIJ-D-18-01165
  • Thim T et al., Evaluation and management of nonculprit lesions in STEMI. J Am Coll Cardiol Intv 2020; 13: 1145-54
  • Erbay A et al., Feasibility and diagnostic reliability of quantitative flow ratio in the assessment of non-culprit lesions in acute coronary syndrome. Int Journal Cardiovasc Imaging 2021; doi.org:10.1007/s10554-021-02195-2
  • Tang J et al., Clinical implication of QFR in patients with ST-segment elevation myocardial infarction after drug-eluting stent implantation. Int J Cardiovasc Imaging 2021; 37: 755-766; doi.org: 10.1007/s10554-020-02068-0

Share this article on:

LinkedIn
Twitter

Sign up for our newsletter

Subscribe now to find out more about our solutions, latest publications and future releases.

By providing your information and continuing, you agree to Medis’ Terms of Use and Privacy Policy *