• Approximately 60-70% of coronary lesions in daily practice are eccentric.
• Lesion assessment from a single view can lead to under-estimation of its physiologic severity.
• The true 3D length of a coronary artery is needed for a proper calculation of the flow velocity.
• There will be situations where a single view may work, but these need to be further investigated.
• The 3D QCA approach using two views is the most robust and broadly applicable solution – it is the backbone of all subsequent solutions, such as co-registration with Ivus/OCT/CTA, and wall shear stress, strain, bending angles, etc
The Medis QFR® approach is based on the 3D reconstruction of a selected coronary segment from two X-ray angiographic views at least 25 degrees apart, and on the assessment of the flow velocity through the vessel following strict acquisition guidelines. There are several good reasons, why we have chosen this approach rather than trying to develop a solution based on a single angiographic view. While the single angiographic view based QFR may seem attractive, we must realize that this is not recommended to use when the intent of the physiologic estimation is to perform PCI, due to the strong possibility of missing the eccentric lesion.
There are two main reasons for choosing the 3D reconstruction approach:
1) lumen eccentricity, which influences the proper reconstruction of the coronary anatomy from the two views; and
2) vessel foreshortening, which influences the calculation of the proper length of the coronary artery. This plays a major role in the calculation of the flow velocity through the vessel of interest.
1. Eccentric lesions
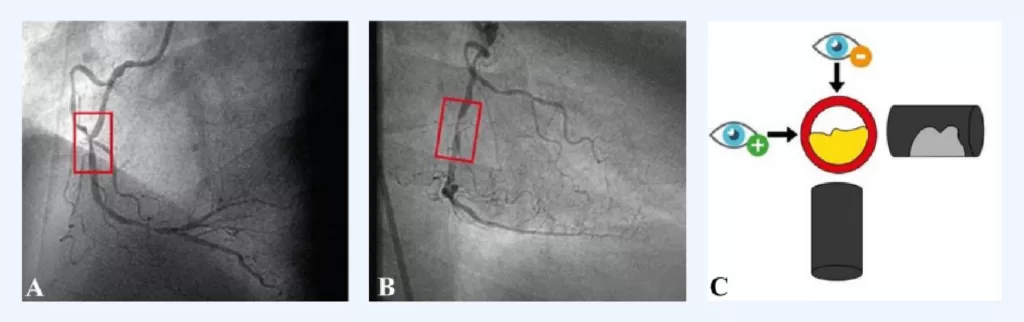
First, Dr G Rigatelli et. al. has very nicely illustrated (Fig. 1) the concept of the eccentric lesions – depending on the angle from which you look at a lesion, significantly different degrees of lesion severity appear [1]. In panels A and B, different severities of the same coronary lesion become clearly apparent, which is even more dramatically illustrated in panel C. In this Panel C, looking from the top the vessel appears to be 0% obstructed, while looking from the left, the vessel is 60% obstructed. Of course, in clinical practice the situation is never as clearcut as illustrated in Fig. 1, but this diagram from Dr Rigatelli certainly reinforces the value of orthogonal views as much as possible within practical constraints.
Fig. 1 Eccentric plaque concept: a coronary artery lesion is often caused by eccentric plaque, which, because a coronary angiography image is 2-dimensional (Panels A and B), requires two orthogonal planes to be effectively evaluated (Panel C). [Ref. 1]
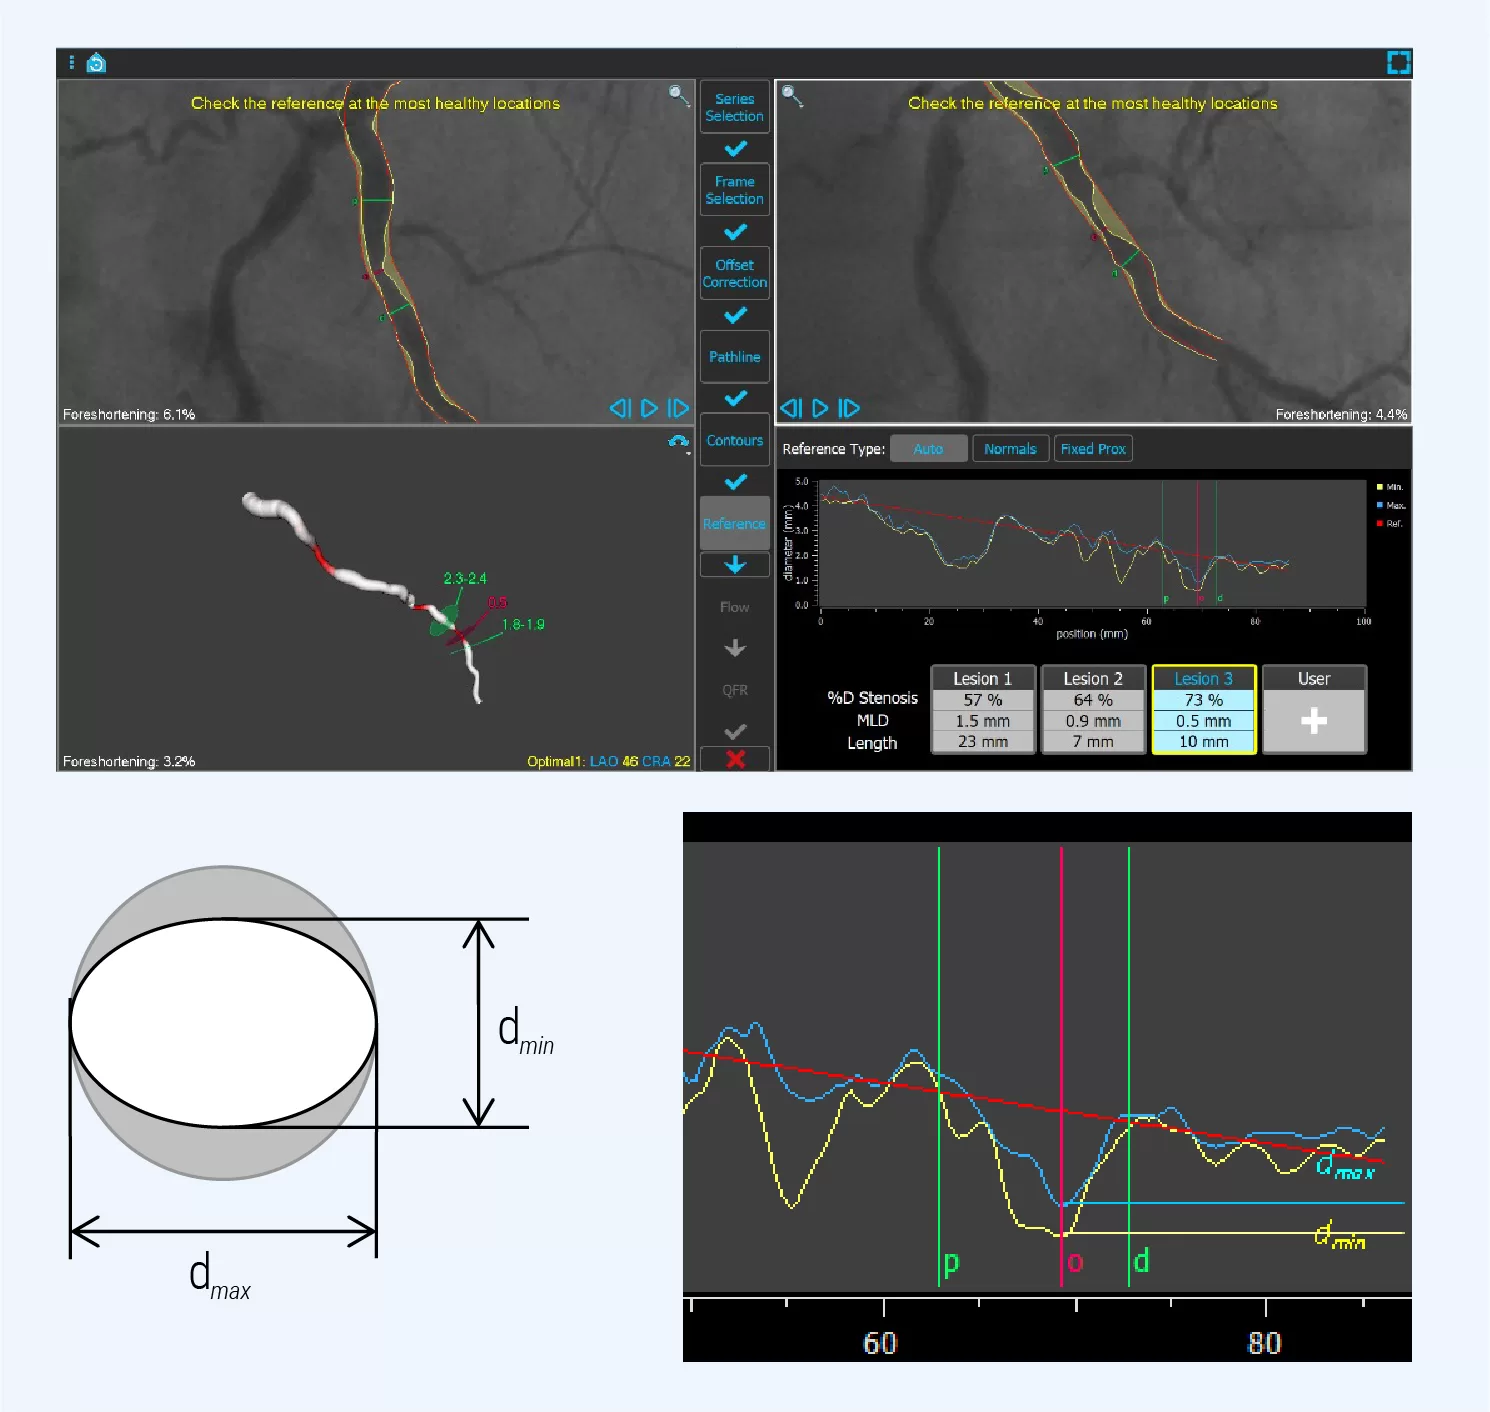
It has been well documented in the literature that approximately 50-60% of atheroma plaques in coronary arteries are eccentric. One of the earlier publications is by Vlodaver et. al. who examined 200 sections and found 70% were eccentric and 30% centric [2]. Another larger study by Simpfendorfer et. al. found in 1500 patients, that 72% of the lesions were eccentric versus 24% concentric [3]. And Mintz et. al. found in 1446 lesions, that 50-60 % of lesions appear to be eccentric in arteriography [4]. We have also done our own validations in a contemporary data set of 148 patients, in which we compared the ratio of the maximum (dmax) and minimum (dmin) diameter at the lesion location (Fig. 2).
Fig. 2. Representative analysis of a patient with the QFR software. In the right lower corner, the diameter function around the coronary narrowing is highlighted. Two diameter functions are visible, one representing the minimal diameter (dmin), and the other the maximal diameter (dmax). From these values the ratio dmax / dmin can be calculated.
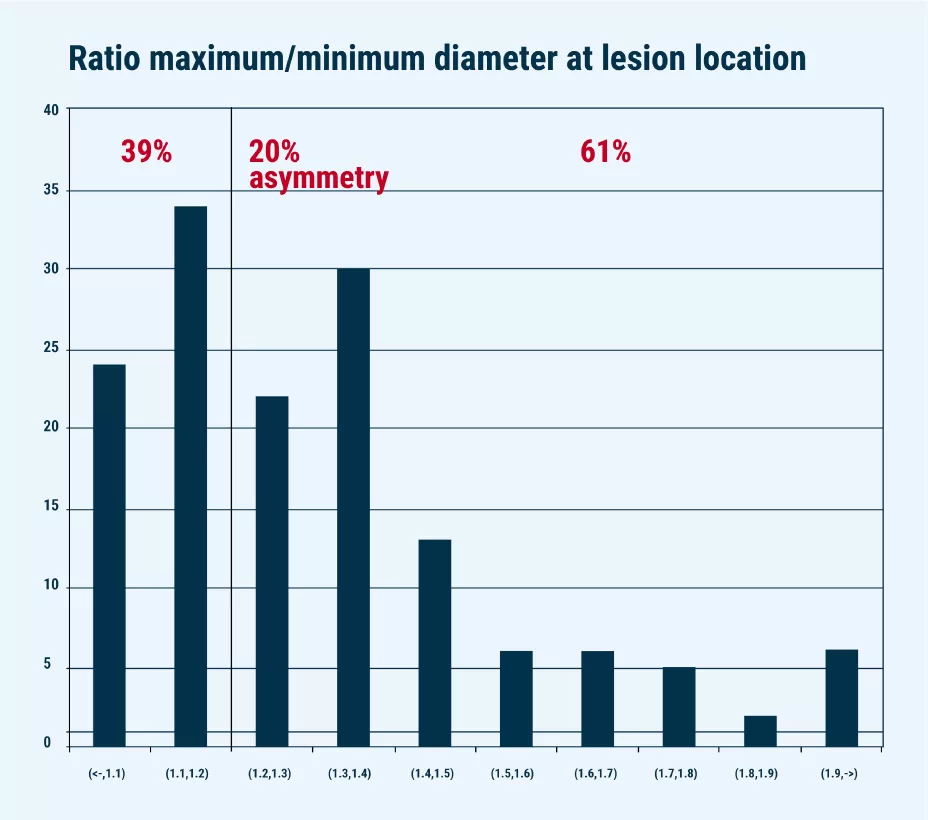
In Fig. 3, the ratio dmax/dmin is presented for the data set of 148 patients along the horizontal axis; along the vertical axis the number of occurrences is plotted. If we assume a threshold of 1.2 for the ratio to define eccentricity vs concentricity, then 61% of the cases are eccentric with the ratio > 1.2, and 39% concentric. This 61% is in line with the numbers from the official publications mentioned above.
Fig. 3: Frequency plot of the ratio dmax/dmin in a contemporary population of 148 patients. The threshold for eccentricity is defined at 20%.
2. Vessel foreshortening
In each QFR analysis the average degree of foreshortening of a vessel is indicated in %. The concept is very simple: a vessel which does not run parallel to the detector in both views will appear shorter than it actually is, which means that its 2D calculated pathline will not be equal to the true, anatomic 3D pathline, but shorter. Since flow velocity is defined as the transit time of the contrast through the vessel divided by the 3D pathline, inaccurate pathline calculation will cause an error in the flow velocity calculation.
References: 1. Rigatelli G, Gianese F, Zuin M. Modern atlas of invasive coronary angiography views: a practical approach for fellows and young interventionalists. Int J Cardiovasc Img 2022; doi.org/10.1007/s10554-021-02489-5 2. Vlodaver, Z.; Edwards, J.E. Pathology of Coronary Atherosclerosis. Progress in Cardiovascular Diseases 1971, 14, 256–274, doi:10.1016/0033-0620(71)90023-5. 3. Simpfendorfer, C.; Belardi, J.; Bellamy, G.; Galan, K.; Franco, I.; Hollman, J. Frequency, Management and Follow-up of Patients with Acute Coronary Occlusions after Percutaneous Transluminal Coronary Angioplasty. The American Journal of Cardiology 1987, 59, 267–269, doi:10.1016/0002-9149(87)90797-1. 4. Mintz, G.S.; Popma, J.J.; Pichard, A.D.; Kent, K.M.; Satler, L.F.; Chuang, Y.C.; DeFalco, R.A.; Leon, M.B. Limitations of Angiography in the Assessment of Plaque Distribution in Coronary Artery Disease. Circulation 1996, 93, 924–931, doi:10.1161/01.CIR.93.5.924.
Interested in Medis QFR®?
Learn more about Medis QFR® or request a demonstration on our product page.